Independent research / Working paper
Fewer Rebalances,
Lower Costs?
Target Dynamics and Portfolio Implementation
Abstract (condensed)
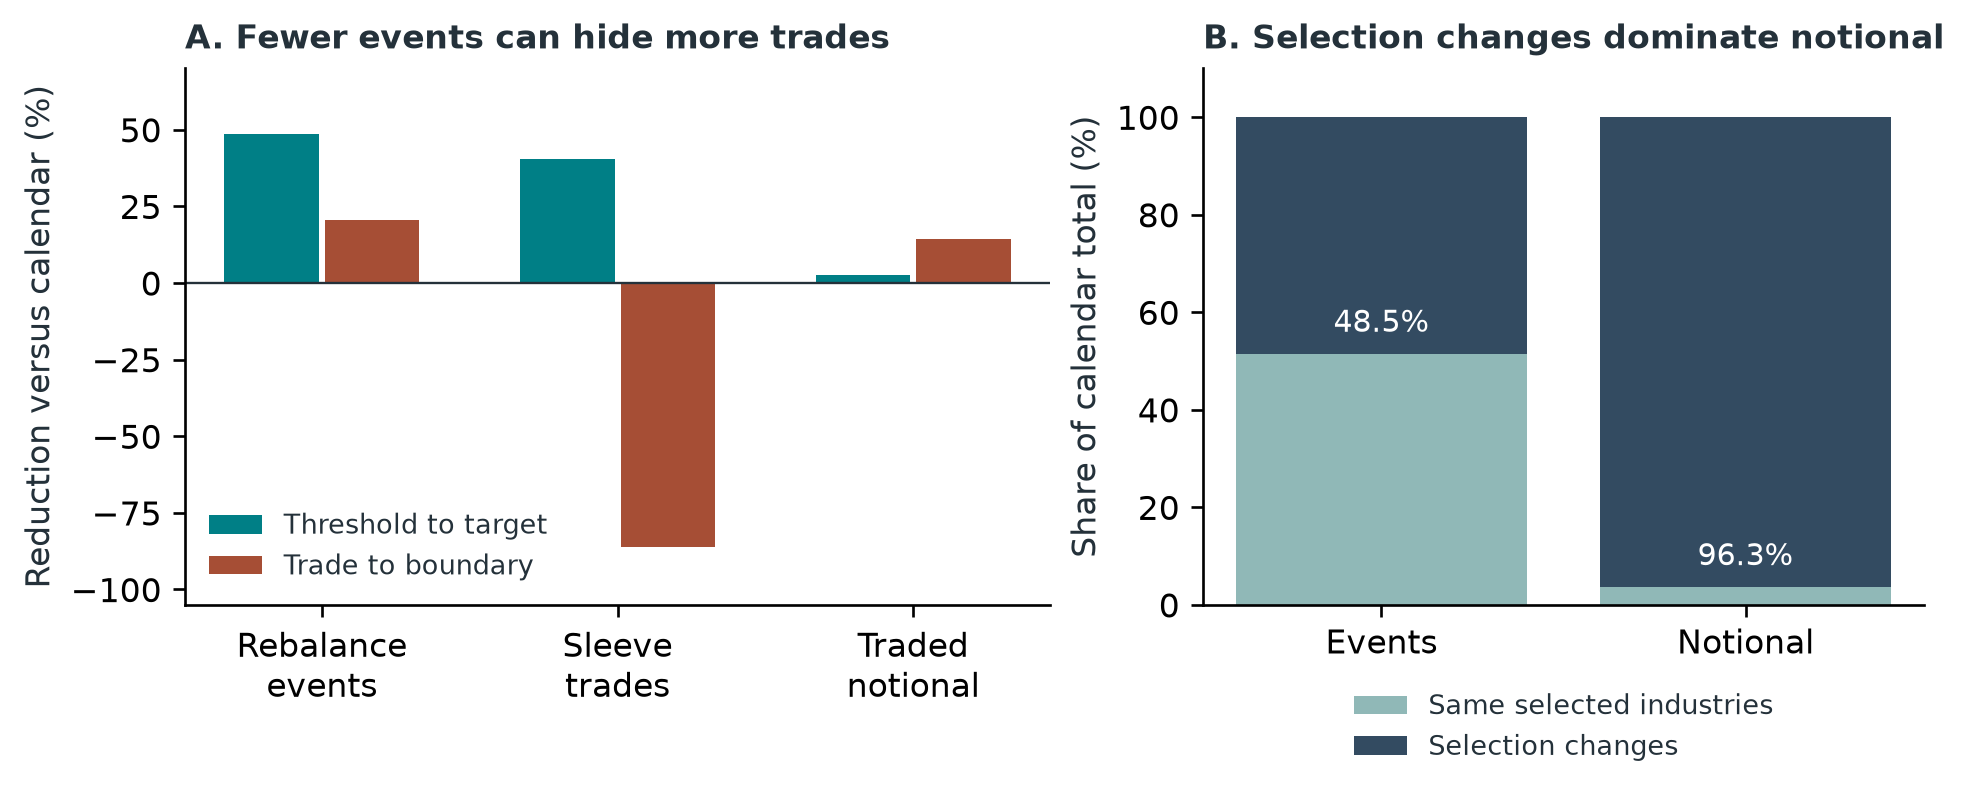
Does reducing the number of portfolio rebalances meaningfully reduce implementation costs? This retrospective study compares calendar and deviation-based policies while holding the target strategy fixed. With moving targets, a large reduction in rebalance events produces only a small reduction in traded notional. Trading frequency, turnover, and tracking error capture different parts of the implementation problem.
Frequency is only part of the cost.
At a 0.10 deviation threshold over 2015–2025, the event-triggered policy reduced rebalance events from 132 to 68: a 48.5% reduction. Traded notional fell by just 2.7%.
At an assumed cost of 10 basis points per dollar traded, that amounts to approximately 1.36 basis points of annual cost savings. Less frequent decisions can still require large trades as the desired portfolio changes.
A boundary policy saved more in assumed costs, but introduced tracking error. The primary adjusted confidence intervals included zero; these comparisons do not establish a reliable performance advantage.
One target strategy. Different implementation rules.
The study uses the Kenneth French 10-industry portfolios and a top-three momentum target, with a 252-day lookback and a 21-day skip. Calendar and deviation-based policies follow the same targets.
- Lagged execution separates information available to the decision from subsequent returns.
- Self-financing accounting deducts proportional trading costs.
- Paired block bootstraps use 4,000 replicates and block lengths of 5, 21, and 63 days.
- Exploratory checks cover fixed targets, alternative periods, thresholds, and a 30-industry universe.
What this does—and doesn’t—show.
This is a retrospective working paper, not a peer-reviewed publication or a live trading record. Transaction costs are modeled rather than observed executions; market impact, taxes, and capacity are not fully represented.
Extensions are exploratory. The results describe the tested target strategy and data, and do not identify an optimal execution rule or establish out-of-sample alpha.
Inspect the work.
The Zenodo release includes the paper, editable LaTeX source, original code, result tables, and checksums. The paper is licensed under CC BY 4.0; original code uses the MIT license.